The City of Yes passed on December 5. And before the online resources are updates, we've already...
Summary of Results
The official estimate was widely reported: The City of Yes (COY) would create around 80K new units over the coming 15 years. But even with extensive research, we have not been able to find breakdowns of this estimate by initiative.
Here, we provide the (to our knowledge) first independent validation of this estimate. Instead of claiming that there is a single correct numbers, we aim to clearly describe our assumptions and show possible impact ranges.
Our estimate is that COY will generate:
59K to 104K new units over the next 15 years.
The middle of this range turns out to be surprisingly close to the official estimate, but uncertainty is large: Many impacts, for example on ADUs, don't have any recent comparison data from nearby locations. We expect to continuously update these estimates as new information comes in, and welcome feedback on our approach.
Key results: New units over next 15 years
| What changed? | New Units | Confidence | Key Assumption | |
| Parking Requirements | Practically removed for Multi-Family | 18 to 41K | Low | Economics of development |
| ADU | 150K-290K units potential | 22K to 44K | Low | Similar development rate as in Los Angeles |
| Transit-oriented Development (TOD) | 25K lots increased FAR | 9K | Medium | FAR increases development per our proprietary model |
| Town center Housing | More FAR for commercial zoning (number not quantified yet) | 9K | Low | Like TOD |
| Total | 59K to 104K |
Calculations
Our approach
In the following, we try to use a ground-up estimate that should be as transparent as possible. Each initiative is estimated independently.
We have reviewed initial official impact estimates, see ULURP document "24DCP033Y_FEIS_02_Analytical Framework.pdf". We note that these documents correspond to earlier proposed versions of COY, not the version that was passed. These analyses do not report impacts by initiative type. The most helpful breakdown has been from the document "24DCP033Y_FEIS_25_Growth-Inducing Aspects of the Proposed Action", page 2:
Citywide, it is expected that compared to the No-Action condition, the Proposed Action would introduce up to approximately 58,000 to 109,000 new units by the 2039 analysis year, averaging an additional 3,900 to 7,300 new units per year. Of the new units, approximately 9,200 to 22,000 units are expected to be designated as affordable, and approximately 27,000 to 40,000 units would consist of ADUs.
ADU
Our analysis finds that ADUs are permitted on 150K to 290K lots in the city. We don't have any development baselines from NYC, so we try to gauge against the ADU program from Los Angeles (LA).
LA legalized ADUs in 2017, and saw construction of around 27K ADUs (see report), or 5K per year. There are approximately 500K single-family housing lots in LA, implying that each year saw construction for around 1% of available lots.
If development in NYC is similar, then we should see 15K-29K ADUs added over the coming decade.
Transit-Oriented Development (TOD)
Our earlier analysis finds that TOD increases the bulk for around 23,000 lots in the city.
To turn this into a development estimate, we use a proprietary development prediction model, but the general approach is quite straightforward:
For each lot, we estimate the probability that it gets developed. We then assume that FAR increases by 50% (roughly the TOD impact) and calculate how much more likely development got.This turns to the following impact estimate:
- Lots: 23,000
- Likelihood of being development over 10 years: 5%
- Increase in FAR: 50%
- Increase in development likelihood due to FAR: 50%
- Number of units for new construction: 10 (seems optimistic)
- => Total new units over 15 years: 9K
Town Center Housing
Town center housing describes an increase in FAR for commercial zoning in low-density districts. These rules are quite complex, and we haven't been able to fully calculate this at a lot level yet. Since the program is similar in many ways to TOD, we make the broad simplification that the impact will be similar. We expect to review this number once we have a deeper analysis of the town center housing changes.
Parking Requirements (PR)
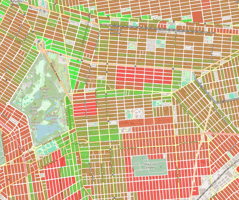
The parking zones are displayed in the map below. In our earlier analysis, we find that the COY changes practically eliminated PR for multi-family (MF) development.

This allows us to create a simplified estimate. When we look at new construction units (2020-2024) by zone we find:
- Core: 19%
- Inner: 33%
- Outer: 43%
- Beyond: 3%
And in this construction, the vast majority (>95%) is from multi-family (>=5 units) development. Just the inner and outer zone make up 76% of new development. So let's assume that 76% of new development now sees their PR removed.
Further assumption:
- Cost of parking mandate on construction: 17% (see article)
- Elasticity of supply: 1.5 (see research paper)
Putting all this together, we estimate that removing PR increases construction by 1,200 to 2800 units per year